Learn fact from fiction and what really matters when it comes to investing in property as we put the top four on the floor. Our experts bust some big myths and share their insights to help you navigate the property market.
Property Investment Myths Debunked

Myth #1 – The Australian Property Market.
In most news stories or backyard conversations surrounding property and investment, people will reference ‘the Australian housing market’ but there is no such beast!
Australia has about 2,000 housing markets and those markets are based on the local economy.
Think about it – when have the Brisbane and Sydney property markets performed the same? Similarly, it’s ridiculous to only count ‘capital cities’ in reports with the massive disparity between Sydney and Darwin or Hobart.
What about Victoria and Queensland? In Victoria 80% of the state is lumped in one location while Victoria fits into Queensland over 7.5 times yet only approximately 45% of the population live in the capital (for those looking to group SEQ, its an area double the size of the greater Sydney area, and more than twice that of greater Melbourne, as such it’s far from a reasonable comparison).
Then what about a single city? Surely, it’s a good measure? Think about where you live, do all suburbs perform the same at the same time? Or do different product types in the same suburb perform the same? The answer is a resounding no.
Notably all regions and cities perform differently and at different times based on the population and economy. In addition, each state’s economy, population, population distribution and laws and taxes as they relate to property, vary. Trying to grasp all that is happening in the country as one market is futile and won’t lead to any good decision making.
What makes matters worse is that the whole discussion is actually based around ‘median prices’ and that one is about to be debunked too!
So why do the ‘groupies’ like to bunch the data? Because it’s easy. The real challenge in investing is getting away from broad statements and clichés that are used to try to simplify the complex and instead finding those who know it and can actually make it simple for you.
Myth #2 – All property doubles every 7 to 10 years
Only the right type (and/or location) of property doubles, and only in certain periods of time; this is not an ‘always’ promise.
Let’s look at what the numbers say; these are the approximate Compound Annual Growth Rates (CAGR) required for property prices to double:
- 10 Years = 7%pa CAGR
- 7 Years = 10%pa CAGR
Interestingly in January 2019 Corelogic released an article suggesting that property had achieved 197% growth over 20 years. Not only does this support the argument that not all property doubles, if you drill down it shows that various cities, suburbs and regions have had wildly varying performance. In essence though, more than half of property hasn’t achieved a 7%pa CAGR.
There are of course those that exceed 10% and those that did for a period of time.
What’s important to note is why those particular areas performed well, and what changed. This is where the value is in understanding what has driven various markets and then identifying the opportunities going forward in those or other markets.
That said, the data is based on median prices, which isn’t a great indicator without doing some real analysis… more on this soon.
When making decisions on property purchases, avoid those that insinuate that all will be well (because ‘all property doubles’), and talk to an expert who knows the area, what is planned for the region’s future and what factors may impact the price of a property in years to come.
Myth #3 – Property is ‘overpriced’ or ‘look out for the bubble’
There is so much written about this but first lets again go back to the fact that these are macro statements. We strongly disagree that all property markets are overpriced or in a ‘bubble’. Of course, there are some examples of specific local markets that are under stress, just like there are markets that will perform well regardless of the broader conditions (and this is entirely our point in this blog, getting the help to know where).
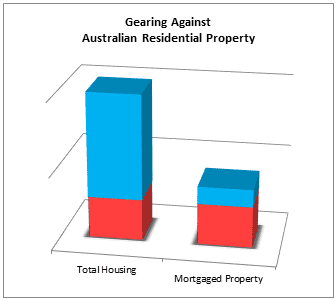
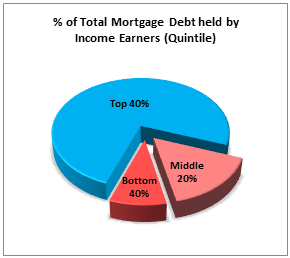
So, let’s look at three macro stats that in themselves a very strong counter argument to the ‘bubblists’…
- The aggregated value of mortgages against that of property values nationally is less than 30% (or in loan terms a loan to value ratio of less than 30%)
- The average LVR on mortgaged property is less than 70%
- 75% of all mortgage debt is held by top 40% of income earners
In essence, we have huge amounts of equity and the people with the debt can afford the debt.
Ultimately, making sound choices is about understanding your personal circumstances, outcomes and building a strategy that mitigates risk and is resilient to cycles by investing in areas where there are strong and persistent factors to support the economy and demand where housing supply is constrained.
Myth #4 – Median prices are always the best measure
Most news reports talk about median prices and treat them as fact. In turn, conversations around the barbeque and when looking to invest become about ‘What has the growth for the area been?’ This is fraught with danger for multiple reasons.
Firstly, any investing is about future performance. Even if medians were an accurate measure, which they aren’t, they are rearward looking. This means that people are relying on historical data that may have no relevance to current or future conditions, to make decisions. This could be a good start or reference point, if you know what you are looking at, and the data is accurate.
Interestingly people rarely ask what data are they actually looking at or listening to? There can be significant differences based on the methodologies in how that data is collected, which means inaccuracies in the information reported or how it’s interpreted. Plus, anomalies in sales, such as over capitalised properties, properties left to ruin and changes in zoning distort the values. Adding in different states and cities that classify properties differently only adds to the confusion. This is before we start looking at how people ‘interpret’ the (inaccurate) data to suit a particular message. To say that medians are ‘rubbery’ at best would be generous.
Only in some instances (very, very few) will median prices be a good indicator of value. This is the case where there are:
- Homogenous property types (i.e. everything is the same in the suburb)
- not tightly held (i.e. regularly sold)
- a very large volume of sales
That said, it would still only be a broad indicator. In short, using medians is a lazy and dangerous way to review a market or opportunity.
So, what is the ‘best’ measure?
That is detailed sampling of the market by someone with the experience and qualifications to conduct comparable analysis (and by analysis, we mean investigation, evaluation, scrutiny and consideration with a basis in sound assumptions in the model). A process that provides insights that you won’t be able to Google or read in your news feed or on a property portal.
Unfortunately, when it comes to property much which is promoted as ‘information’ is regurgitated clichés and off target data (notably avoiding the use of the term ‘analysis’ here) by the groupies, insinuators, bubblists and the lazy.
For more myth busting or if you’d like to discuss how you make sound investment decisions, get in touch with our team. They can also help with an insightful discussion about where real opportunity exits, and (most importantly) what are the right opportunities for your circumstances and goals.


